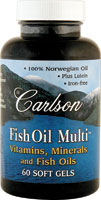
| Carlson Fish Oil Multi | VS | All other Multi Vitamins |
| General | |||||
|---|---|---|---|---|---|
| Other Ingredients | Gelatin, Glycerin, Water, Carob, Beeswax, Olive Oil, Rice Flour, Lecithin (soybeans), Safflower Oil, Glyceryl Stearate, Coconut Oil, Ascorbyl Palmitate. | ||||
| Directions | Take One Soft Gel Daily Only At Meal Time With A Full Glass Of Water Or Beverage. | ||||
| Free Of | Iron, Milk, Wheat, Corn, Salt, Preservatives, Yeast And Sugar. | ||||
| Disclaimer | These Statements Have Not Been Evaluated By The Fda. These Products Are Not Intended To Diagnose, Treat, Cure, Or Prevent Any Disease. | ||||
| Count |
120 Softgels (27.61 Softgels higher than average)
|
vs |
92.39 Softgels
|
||
| Serving |
1 Softgel (1.37 Softgel lower than average)
|
vs |
2.37 Softgel
|
||
| Servings |
120 (66.42 higher than average)
|
vs |
53.58
|
||
| Description | Vitamins, Minerals And Fish Oils Super-strength, Iron-free, Balanced Formula. Provides Essential Vitamins And Minerals. Contains Lutein - Important For Healthy Vision. Supplies Fish Oil Concentrate Rich In Epa & Dha. | ||||
| Supplement facts | |||||
|---|---|---|---|---|---|
| Total Fat (lipids) |
1 g (0.25 g lower than average)
|
vs |
1.25 g
|
||
| Protein |
1 g (3.32 g lower than average)
|
vs |
4.32 g
|
||
| Calories |
9 (13.57 lower than average)
|
vs |
22.57
|
||
| Calories From Fat |
4.5 (5.12 lower than average)
|
vs |
9.62
|
||
| Biotin |
150 mcg (208.54 mcg lower than average)
|
vs |
358.54 mcg
|
||
| Vitamin B12 (As Cyanocobalamin) |
60 mcg (1518.49 mcg lower than average)
|
vs |
1578.49 mcg
|
||
| Folate (As Folic Acid) |
200 mcg (225.41 mcg lower than average)
|
vs |
425.41 mcg
|
||
| Niacin (As Niacinamide) |
20 mg (23.02 mg lower than average)
|
vs |
43.02 mg
|
||
| Iodine (As Potassium Iodide) |
150 mcg (19.29 mcg higher than average)
|
vs |
130.71 mcg
|
||
| Magnesium (As Magnesium Oxide) |
50 mg (30.07 mg lower than average)
|
vs |
80.07 mg
|
||
| Pantothenic Acid (As D-Calcium Pantothenate) |
20 mg (32.52 mg lower than average)
|
vs |
52.52 mg
|
||
| Riboflavin (Vitamin B2) |
8.5 mg (15.47 mg lower than average)
|
vs |
23.97 mg
|
||
| Vitamin A (as beta carotene) |
5000 IU (4994 IU higher than average)
|
vs |
6,637 IU
|
||
| Vitamin D3 (as cholecalciferol) |
800 IU (172.86 IU higher than average)
|
vs |
627.14 IU
|
||
| Vitamin C (as calcium ascorbate) |
300 mg (81.08 mg lower than average)
|
vs |
381.08 mg
|
||
| Boron (as Glycinate) |
1 mg (78.96 mg lower than average)
|
vs |
79.96 mg
|
||
| Thiamin (as thiamin HCl) (vitamin B1) |
7.5 mg (16.97 mg lower than average)
|
vs |
24.47 mg
|
||
| Phosphatidylcholine |
25 mg (6.5 mg higher than average)
|
vs |
18.50 mg
|
||
| Vitamin E (as d-alpha tocopherol from soy) | 200 IU | ||||
| Chromium (from chromium nicotinate) |
120 mcg (15 mcg lower than average)
|
vs |
135.00 mcg
|
||
| Lutein (FloraGLO by Kemin Ind.) | 400 mcg | ||||
| Vanadium (BMOV) | 200 mcg | ||||
| Fish Oil Concentrate | 400 mg | ||||
| EPA (Eicosapentaenoic Acid) |
65 mg (160 mg lower than average)
|
vs |
225.00 mg
|
||
| Lemon Bioflavonoid Complex |
25 mg (12.78 mg lower than average)
|
vs |
37.78 mg
|
||
| Manganese (as Glycinate) |
2 mg (0.42 mg higher than average)
|
vs |
1.58 mg
|
||
| DHA |
45 mg (131.86 mg lower than average)
|
vs |
176.86 mg
|
||
| Vitamin B6 (as pyridoxine HCI) |
10 mg (17.5 mg lower than average)
|
vs |
27.50 mg
|
||
| Molybdenum (as glycinate) |
37.5 mcg (83.15 mcg lower than average)
|
vs |
120.65 mcg
|
||
| Zinc (as zinc glycinate) |
7.5 mg (8.25 mg lower than average)
|
vs |
15.75 mg
|
||
| Selenium (as selenomethionine) |
105 mcg (27.27 mcg higher than average)
|
vs |
77.73 mcg
|
||
| Copper (as copper glycinate) |
1 mg (0.71 mg lower than average)
|
vs |
1.71 mg
|
||
| Calcium (carbonate) |
25 mg (348.89 mg lower than average)
|
vs |
373.89 mg
|
||
