VS

Home > Multi Vitamins > FoodScience Of Vermont Daily Best

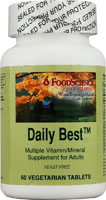
FoodScience of Vermont Daily Best

Details Rankings Comparisons Related
FoodScience of Vermont Daily Best
Compare with other Multi Vitamins
 Compare
FoodScience of Vermont Daily Best VS
All other Multi Vitamins
General
Other Ingredients Calcium Ascorbate, Calcium Carbonate, Calcium Pantothenate, Mineral Aspartates (magnesium, Potassium, Iron, Zinc), Silica, Cellulose, Magnesium Oxide, Potassium Citrate, Amino Acid Chelates (calcium, Boron, Copper, Selenium, Molybdenum), Zinc Picolinate, Ferrous Glycinate, Ferrous Fumarate, Manganese Gluconate, Chromium Polynicotinate. 
Directions Take 1 Tablet Daily With Breakfast. 
Warnings If Pregnant Or Nursing, Consult Your Health Care Practitioner Before Taking This Product. Accidental Overdose Of Iron-containing Products Is A Leading Cause Of Fatal Poisoning In Children Under 6. In Case Of Accidental Overdose, Call A Doctor Or Poison Control Center. 
Free Of Citrus, Corn, Egg, Gluten, Milk, Sodium, Soy, Wheat, Yeast, Added Sugars, Added Starches, Synthetic Dyes, Artificial Flavoring And Preservatives. 
Disclaimer These Statements Have Not Been Evaluated By The Fda. These Products Are Not Intended To Diagnose, Treat, Cure, Or Prevent Any Disease. 
Count 60 Vegetarian Tablets 
Serving
1 Tablet (1.37 Tablet lower than average)
vs
2.37 Tablet

Servings
60  (6.42 higher than average)
vs
53.58

Description Multiple Vitamin/mineral Supplement For Adults-- Yeast Free A Prolonged Release, Vegetarian And Yeast Free Multiple Vitamin/mineral Supplement For Adults. A Full Spectrum Of Vitamins, Minerals, And Other Nutrients In A Base Of Alfalfa, Chamomile, Rosehips, Red Raspberry, And Parsley. One Tablet Formula. 
Supplement facts
Iron (Fe)
10 mg (1.62 mg higher than average)
vs
8.38 mg

Calcium (Ca)
100 mg (60.06 mg lower than average)
vs
160.06 mg

Magnesium (Mg)
50 mg (22.09 mg lower than average)
vs
72.09 mg

Potassium (K)
30 mg (37.35 mg lower than average)
vs
67.35 mg

Zinc (Zn)
10 mg (1.36 mg lower than average)
vs
11.36 mg

Copper (Cu)
0.25 mg (0.99 mg lower than average)
vs
1.24 mg

Manganese (Mn)
2 mg (1.55 mg lower than average)
vs
3.55 mg

Selenium (Se)
20 mcg (49.09 mcg lower than average)
vs
69.09 mcg

Vitamin C (total ascorbic acid)
300 mg (146.9 mg higher than average)
vs
153.10 mg

Pantothenic acid
60 mg (37.09 mg higher than average)
vs
22.91 mg

Biotin
150 mcg (208.54 mcg lower than average)
vs
358.54 mcg

Chromium
20 mcg (76.92 mcg lower than average)
vs
96.92 mcg

Vitamin B6
60 mg (49.8 mg higher than average)
vs
10.20 mg

Vitamin B12
60 mcg (14.15 mcg lower than average)
vs
74.15 mcg

Folate (As Folic Acid)
400 mcg (25.41 mcg lower than average)
vs
425.41 mcg

Niacin (As Niacinamide)
60 mg (16.98 mg higher than average)
vs
43.02 mg

Molybdenum
10 mcg (35.72 mcg lower than average)
vs
45.72 mcg

Riboflavin (Vitamin B2)
60 mg (36.03 mg higher than average)
vs
23.97 mg

Vitamin E (as d-alpha tocopheryl succinate)
120 IU (20.52 IU lower than average)
vs
140.52 IU

Iodine (from kelp)
75 mcg (135.71 mcg lower than average)
vs
210.71 mcg

PABA (para-aminobenzoic acid)
60 mg (29.11 mg higher than average)
vs
30.89 mg

Inositol
60 mg (21.86 mg higher than average)
vs
38.14 mg

Boron
1 mg (0.11 mg higher than average)
vs
0.89 mg

Betaine (as betaine HCI)
20 mg (26.24 mg lower than average)
vs
46.24 mg

Thiamine
60 mg (26.06 mg higher than average)
vs
33.94 mg

Choline
60 mg (27.26 mg higher than average)
vs
32.74 mg

Pectin
25 mg (7.42 mg higher than average)
vs
17.58 mg

Alfalfa (leaf) Medicago Sativa
5 mg (12.75 mg lower than average)
vs
17.75 mg

Hesperidin
10 mg (0.19 mg lower than average)
vs
10.19 mg

Parsley Leaf
5 mg (41.67 mg lower than average)
vs
46.67 mg

Vitamin D2 (ergocalciferol)
400 IU (210.05 IU higher than average)
vs
189.95 IU

Rose Hips
5 mg (0.5 mg lower than average)
vs
5.50 mg

Mixed Citrus Bioflavonoid
50 mg (20.92 mg lower than average)
vs
70.92 mg

Vitamin A (4000 IU as vitamin A palmitate and 10000 IU as beta-carotene) 14,000 IU 
Chamomile 5 mg 
Red Raspberry 5 mg 


Scroll To Top

saved