VS

Home > Multi Vitamins > High Performance Fitness 1st Step For Energy Multi-Vitamin And Mineral Citrus Blast

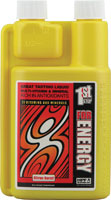
High Performance Fitness 1st Step For Energy Multi-Vitamin and Mineral Citrus Blast

Details Rankings Comparisons Related
High Performance Fitness 1st Step For Energy Multi-Vitamin and Mineral Citrus Blast
Compare with other Multi Vitamins
 Compare
High Performance Fitness 1st Step For Energy Multi-Vitamin and Mineral Citrus Blast VS
All other Multi Vitamins
General
Category Liquid Multi-vitamins 
Other Ingredients Purified Water, Fructose, Citric Acid, Natural Cranberry Flavor, Potassium Sorbate, Sodium Benzoate 
Directions Shake Well Before Using Remove Chamber Cap Squeeze Liquid Into Chamber Consume 
Disclaimer These Statements Have Not Been Evaluated By The Fda. These Products Are Not Intended To Diagnose, Treat, Cure, Or Prevent Any Disease. 
Count
16 fl (76.39 fl lower than average)
vs
92.39 fl

Serving
1 fl (1.37 fl lower than average)
vs
2.37 fl

Servings
16  (37.58 lower than average)
vs
53.58

Description Great Tasting Liquid 71 Vitamins And Minerals Rich In Antioxidants Used By Champions Rich In Antioxidants Voted Best Tasting Multi Release Your Inner Strength 
Supplement facts
Iron (Fe)
9 mg (0.62 mg higher than average)
vs
8.38 mg

Sugars
2 g (2.29 g lower than average)
vs
4.29 g

Calcium (Ca)
60 mg (100.06 mg lower than average)
vs
160.06 mg

Magnesium (Mg)
100 mg (27.91 mg higher than average)
vs
72.09 mg

Potassium (K)
100 mg (32.65 mg higher than average)
vs
67.35 mg

Sodium (Na)
5 mg (26.92 mg lower than average)
vs
31.92 mg

Zinc (Zn)
23 mg (11.64 mg higher than average)
vs
11.36 mg

Manganese (Mn)
5 mg (1.45 mg higher than average)
vs
3.55 mg

Selenium (Se)
150 mcg (80.91 mcg higher than average)
vs
69.09 mcg

Vitamin E (alpha-tocopherol)
45 IU (8.6 IU lower than average)
vs
53.60 IU

Calories
(14.57 lower than average)
vs
22.57

Biotin
450 mcg (91.46 mcg higher than average)
vs
358.54 mcg

Chromium
150 mcg (53.08 mcg higher than average)
vs
96.92 mcg

Vitamin C (As Ascorbic Acid)
90 mg (250.76 mg lower than average)
vs
340.76 mg

Vitamin B12 (As Cyanocobalamin)
9 mcg (1569.49 mcg lower than average)
vs
1578.49 mcg

Folate (As Folic Acid)
600 mcg (174.59 mcg higher than average)
vs
425.41 mcg

Iodine
150 mcg (38.2 mcg higher than average)
vs
111.80 mcg

Vitamin D (As Cholecalciferol)
600 IU (209.06 IU higher than average)
vs
390.94 IU

Vitamin A (as beta carotene)
7500 IU (7494 IU higher than average)
vs
6,637 IU

Vitamin B6 (as Pyridoxine)
3 mg (13.27 mg lower than average)
vs
16.27 mg

Vitamin B2 (riboflavin)
2.55 mg (26.11 mg lower than average)
vs
28.66 mg

Vitamin B1 (thiamine)
2.25 mg (10.13 mg lower than average)
vs
12.38 mg

Vitamin B3 (Niacin)
33 mg (0.8 mg lower than average)
vs
33.80 mg

Vitamin B5 (Pantothenic Acid)
125 mg (79.72 mg higher than average)
vs
45.28 mg


Scroll To Top

saved