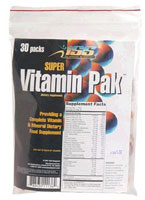
| ISS Research Super Vitamin Pak | VS | All other Multi Vitamins |
| General | |||||
|---|---|---|---|---|---|
| Other Ingredients | Whey (milk), Gelatin, Stearic Acid, Magnesium Stearate, Vegetable Glycerin, Soybean, Water, Mixed Tocopherols And Rose Hips. Statement | ||||
| Directions | Take One Pak Daily With Food As A Dietary Supplement. May Be Taken At One Time Or Periodically With Meals Throughout The Day. | ||||
| Warnings | Accidental Overdose Of Iron-containing Products Is A Leading Cause Of Fatal Poisoning In Children Under Six. In Case Of Accidental Overdose, Call A Physician Or Poison Control Center Immediately. | ||||
| Disclaimer | These Statements Have Not Been Evaluated By The Fda. These Products Are Not Intended To Diagnose, Treat, Cure, Or Prevent Any Disease. | ||||
| Count |
30 Pills (62.39 Pills lower than average)
|
vs |
92.39 Pills
|
||
| Serving |
1 Pack (1.37 Pack lower than average)
|
vs |
2.37 Pack
|
||
| Servings |
30 (23.58 lower than average)
|
vs |
53.58
|
||
| Description | Providing & Complete Vitamins & Mineral Dietary Food Supplement Essential, But Often Overlooked, Vitamins And Minerals Are A Necessity For Optimum Health And Performance. Become Deficient In These Vital Micronutrients And Not Only With Your Strength And Performance Suffer, But You Will Be Jeopardizing Your Health And Well-being Now And In The Years To Come. Super Vitamin Pak Is A Full Spectrum 30 Day Supply Of Vitamins And Minerals Essential To Your Body's Needs On A Daily Basis. Super Vitamin Pak 's Are Packaged Individually For Your Convenience. | ||||
| Supplement facts | |||||
|---|---|---|---|---|---|
| Glutamic acid |
50 mg (315.08 mg lower than average)
|
vs |
365.08 mg
|
||
| Biotin |
100 mcg (258.54 mcg lower than average)
|
vs |
358.54 mcg
|
||
| Vitamin C (As Ascorbic Acid) |
1000 mg (659.24 mg higher than average)
|
vs |
340.76 mg
|
||
| Vitamin B12 (As Cyanocobalamin) |
100000 mcg (98421.51 mcg higher than average)
|
vs |
1578.49 mcg
|
||
| Folate (As Folic Acid) |
400 mcg (25.41 mcg lower than average)
|
vs |
425.41 mcg
|
||
| Niacin (As Niacinamide) |
100 mg (56.98 mg higher than average)
|
vs |
43.02 mg
|
||
| Iodine (As Potassium Iodide) |
75 mcg (55.71 mcg lower than average)
|
vs |
130.71 mcg
|
||
| Magnesium (As Magnesium Oxide) |
250 mg (169.93 mg higher than average)
|
vs |
80.07 mg
|
||
| Pantothenic Acid (As D-Calcium Pantothenate) |
100 mg (47.48 mg higher than average)
|
vs |
52.52 mg
|
||
| Copper (As Copper Sulfate) |
2 mg (0.55 mg higher than average)
|
vs |
1.45 mg
|
||
| PABA (para-aminobenzoic acid) |
0.1 mg (30.79 mg lower than average)
|
vs |
30.89 mg
|
||
| Choline (as bitartrate) |
100 mg (55.83 mg higher than average)
|
vs |
44.17 mg
|
||
| Inositol |
100 mg (61.86 mg higher than average)
|
vs |
38.14 mg
|
||
| Vitamin B1 (as Thiamin Mononitrate) |
100 mg (79.11 mg higher than average)
|
vs |
20.89 mg
|
||
| Boron (as Glycinate) |
3 mg (76.96 mg lower than average)
|
vs |
79.96 mg
|
||
| Potassium (as potassium chloride) |
50 mg (8.87 mg higher than average)
|
vs |
41.13 mg
|
||
| Vitamin B2 (riboflavin) |
100 mg (71.34 mg higher than average)
|
vs |
28.66 mg
|
||
| Manganese (as Sulfate) |
1 mg (2.31 mg lower than average)
|
vs |
3.31 mg
|
||
| Vitamin E (as d-Alpha Tocopherol Acetate) |
400 IU (310.56 IU higher than average)
|
vs |
89.44 IU
|
||
| Chromium (picolinate) |
200 mcg (81.59 mcg higher than average)
|
vs |
118.41 mcg
|
||
| Calcium (as Calcium Carbonate, Dicalcium Phosphate) |
500 mg (140 mg higher than average)
|
vs |
360.00 mg
|
||
| Vitamin B6 (as pyridoxine HCI) |
100 mg (72.5 mg higher than average)
|
vs |
27.50 mg
|
||
| Lecithin (soy) |
1200 mg (1059.38 mg higher than average)
|
vs |
140.62 mg
|
||
| Zinc (as Oxide) |
11.5 mg (1.88 mg lower than average)
|
vs |
13.38 mg
|
||
| Lemon Bioflavonoid |
100 mg (73.68 mg higher than average)
|
vs |
26.32 mg
|
||
| Vitamin A (Fish Liver Oil) |
100000 IU (99974 IU higher than average)
|
vs |
26,000 IU
|
||
| Vitamin D (Fish Liver Oil) |
400 IU (22.22 IU higher than average)
|
vs |
377.78 IU
|
||
| Iron (as fumarate) |
8 mg (3.62 mg lower than average)
|
vs |
11.62 mg
|
||
